This post is a follow-up on ‘Walled Garden: Communities and Networks post Web 2.0 (part 1)‘

After discussing the various features of walled gardens, we formed groups and focused on one of the three project topics. Our team took a special interest in the semi-permeability and the root systems and feeds of the walled gardens. How do we measure the permeability of sites?
Characteristics of the permeability of a site include whether the site provides an API, embed code, widget, rss, e-mail, share/this button.
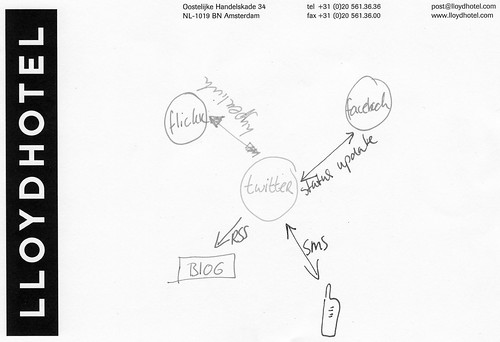
One of the ways to visualize the outcomes of our discussions goals concerning dataflows in (semi-permeable) walled gardens is to make a blueprint. Initial sketch:
The following image is a visualization of Walled Garden Data Flows / Characterizing the types of Web 2.0 data flows between three applications: Facebook, Twitter and Flickr. Walled Garden, 2008 by the Digital Methods Initiative.
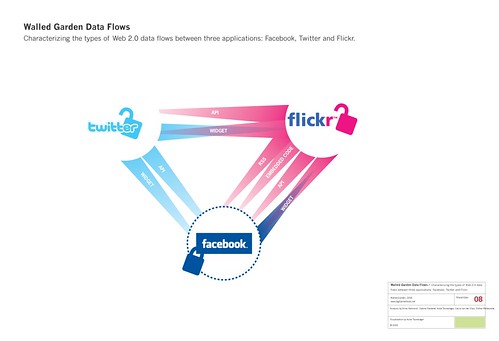
Analysis by Anne Helmond, Sabine Niederer, Auke Touwslager, Laura van der Vlies, Esther Weltevrede. Visualization by Auke Touwslager. © 2008.
As a case study we also attempted to map the data flows of my SNS web data. Please note that this map is far from accurate and complete, it is an initial sketch.
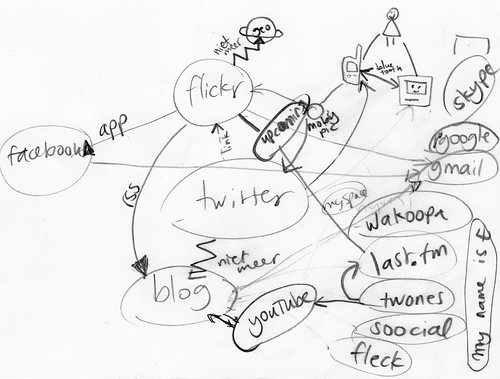
First (unfinished) draft in Illustrator:

A question that arises from data flowing from one site to another is what happens if one person moves with the data? For example, does the Creative Commons license change or disappear?
Visualizing the Walled Garden: Communities and Networks post Web 2.0 (part 2) – http://bit.ly/mHwg