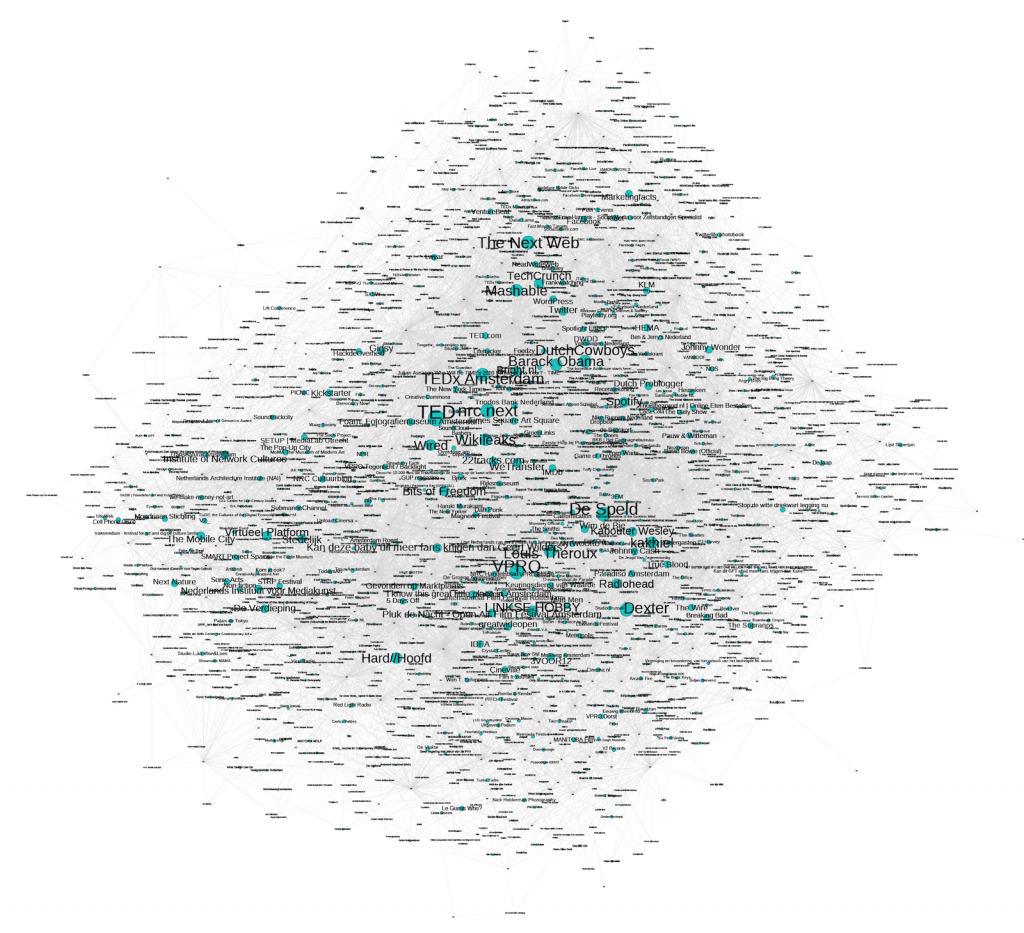
My colleague Bernhard Rieder added a new feature to his netvizz application which now allows you to create a network graph of your friends and their Likes. Instead of a network visualization that shows the connections between your friends, this bipartite graph includes two different Facebook objects in one graph: your friends and their Likes and the connections between them.
My graph contains 308 users (all anonymized in the images), 21240 different liked objects and 31189 likes (click to enlarge images). To reduce the map to a readable format I’ve eliminated users who like less than three objects and objects that have been liked by less than three people.

As expected we can find clusters around television shows, bands, albums, musea, technology blogs but also more local things such as venues in Amsterdam. An interesting similarity with my Austrian colleague his network is political satire. His graph shows Kann dieser seelenlose Ziegelstein mehr Freunde haben als H.C. Strache? (Can this soulless brick have more friends than HC Strache?) as one of the most liked objects and within my Dutch network Kan deze baby uil meer fans krijgen dan Geert Wilders? (Can this baby owl have more friends than Geert Wilders?) and LINKSE HOBBIES (Left-Wing Hobbies) are amongst the most liked objects.

Instead of visualizing people as hubs within networks this method also allows you to analyze how objects other than people (the word object is used here in the Facebook sense where everything is an object within its database/OpenGraph architecture), such as bands or political parties, can act as connectors between people. What are likeable objects (or issues) that connect people and other objects and issues? It is important to note that the graph only includes internally liked Facebook objects such as Pages and no externally liked objects such as websites which have been liked using the Like Button. The Facebook API only returns internally liked objects and not externally liked objects.
This looks great. I just used netvizz for the first time the other day to plot my Facebook network (using Gephi), more just to see what it looked like than anything else. I’m in the final few weeks of my PhD and have been doing a lot of incredibly laborious manual data collection and data input in order to generate visualisations, so netvizz was somewhat of a revelation for me! Will have to try this out. I was hoping that netvizz could be used to see how a group of ‘Like’ pages like each other but I don’t think that’s possible yet.
Good to hear! I also tried it mainly as an exploration of my own network.
Maybe you could ask the author of the tool, Bernhard Rieder? http://thepoliticsofsystems.net/2012/09/new-netvizz-feature-bipartite-like-networks/